Salt Lake County:
Year Over Year Comparison
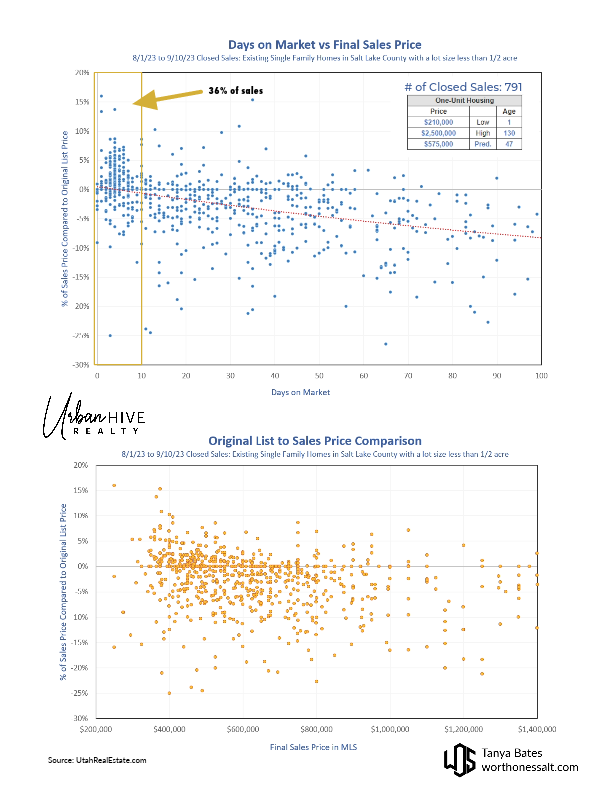
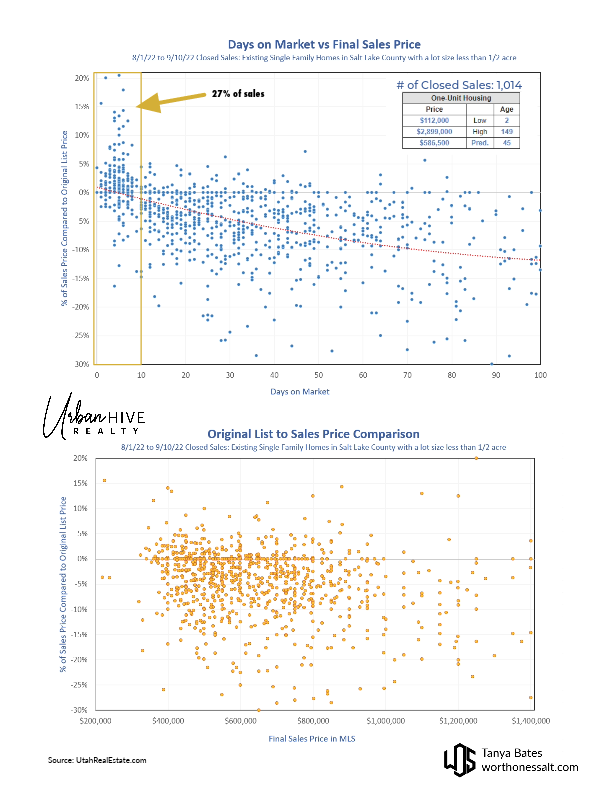
This is an interesting visual that highlights the number of sales when compared to the same time as last year. Those little dots represent closed sales of existing single family homes in Salt Lake County!
Checkout how many sales are going under contract within 10 days right now! This is happening even as the median days on market and the months’ supply of available homes are steadily increasing. Strategically pricing homes in the weird market we’re navigating through is only getting more important.
What stands out to you??
Need help pricing a home or submitting a solid offer? Feel free to reach out anytime, even if it’s just to bounce some ideas off me. I specialize in it and love helping clients make informed decisions!
#MarketSnippets
#DataStorytelling
#SaltLakeRealEstate
#TipsandTricks
Market Snippets: 9-13-23 PDF Version

